
Welcome to IRSV 2.0, a web-based interactive visual analtyics system for bridge managment. IRSV is a prototype Integrated Remote Sensing and Visualization system. Our system is designed under the scope of our multi-year research project on developing and validating Commercial Remote Sensing (CRS) applications that can enhance current bridge management systems (BMS). A longer-range objective is to enable the IRSV components to be integrated into PONTIS and other state and local BMS applications. Full deplyment of IRSV will contain a high resolution visual database using, in part, on-site bridge inspection data. Additional data that is not included in semi-annual bridge inspections includes LiDAR imaging, sub-inch aerial photography, and Infrared images. Partners in this first phase research project have included the City of Charlotte DOT and the North Carolina DOT. The multi-disciplinary research team includes the UNC Charlotte Center for Transportation Policy Studies (lead), the Charlotte Visualization Center, ImageCat, Inc., Boyle Consulting Engineers PLLC, and Dr. C. Michael Walton, P.E. This project is supported by a Cooperative Agreement with the U.S. Department of Transportation, Research and Innovative Technology Administration.
IRSV, the web-based visual analytics system is still an on-going project that is conducted by students and researchers in both civil engineering and computer science departments of UNC Charlotte. The current vernilla version of IRSV only presents basic functions, such as data exploration, view coordination and basic annotation. Higher functions as ‘evidence collection’, ‘analytical reporting’ and ‘collaboration’ are disabled for stability purposes. With future updates, IRSV will re-enable this functions and present to the public with a more comprehensive working environment.
Screenshot of the application:
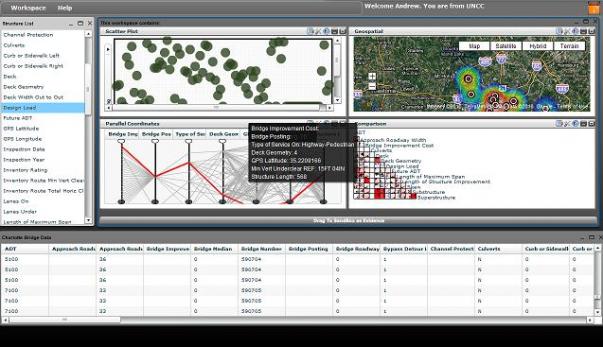
IRSV 2.0
‘WorkSpace’: is the same concept as a ‘desktop’ for a windows/Macintosh computer. However, the novel design of IRSV allows you to create multiple workspaces at one location. So you can start different analytical processes based upon the needs. In a workspace, you can see multiple coordinated visualizations. You can ‘maximize’ or ‘minimize’ individual workspace by clicking corresponding icons on its upper right corner. Workspace can be collective as evidence through dragging it onto the ‘orange drop box’ to the right on the screen.
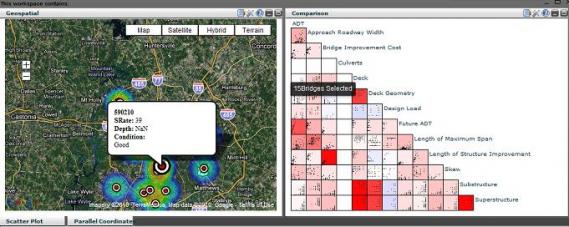
Example of an IRSV 2.0 Workspace
Credits
IRSV is implemented by Xiaoyu Wang (viztang@gmail.com) at Charlotte Visualization Center. The visaul analytics framework IRSV resides on is an on-going research between Xiaoyu Wang and Dr. William Ribarsky. Dengsong Shi has contribute tremendously in the development process.
Acknowledgements
This project is supported by grant number DTOS59-07-H-0005 from the United States Department of Transportation (USDOT), Research and Innovative Technology Administration (RITA). The views, opinions, findings and conclusions reflected in this publication are the responsibility of the authors only and do not represent the official policy or position of the USDOT, RITA, or any State or other entity. The authors also would like to acknowledge the guidance and contributions of Mr. Caesar Singh, the Program Manager at USDOT; and the technical assistance of Dr. Moy Biswas of the North Carolina DOT (NCDOT), Mr. Garland Haywood of NCDOT Division 10, and Mr. Jimmy Rhyne of Charlotte DOT.